




Analyze
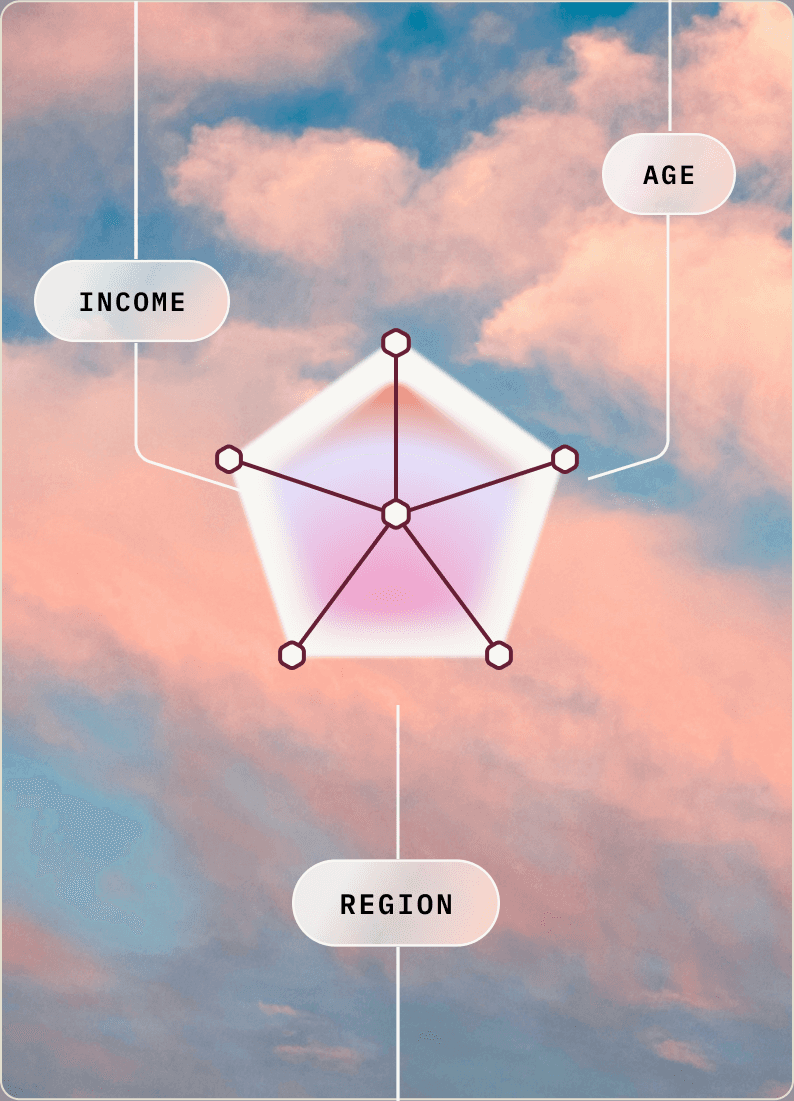
When sales teams ask about data for specific sub-segments like regions or verticals, you can get insights in seconds.
Without Flowerplot
“Cross-tabbing is the most difficult part. In massive spreadsheets, if it’s a question with a lot of answer options, it’s a really wide sheet and having to scroll across to compare Millennials versus Gen Z is time consuming.”
—Matilda Schieren, freelance content strategist, formerly Brand & Editorial, Sprout Social


Curate
Once you’ve got the data to highlight your strongest stories, whether those are key insights, or designed charts, you can save them to your account and share them with anyone.
Without Flowerplot
“Data is what gets prospects and customers to pay attention and understand the value of our business. Sales and customer success are constantly asking our marketing and PR team ‘Do we have a stat on this?’”
—Content strategist, enterprise B2B SaaS


Design
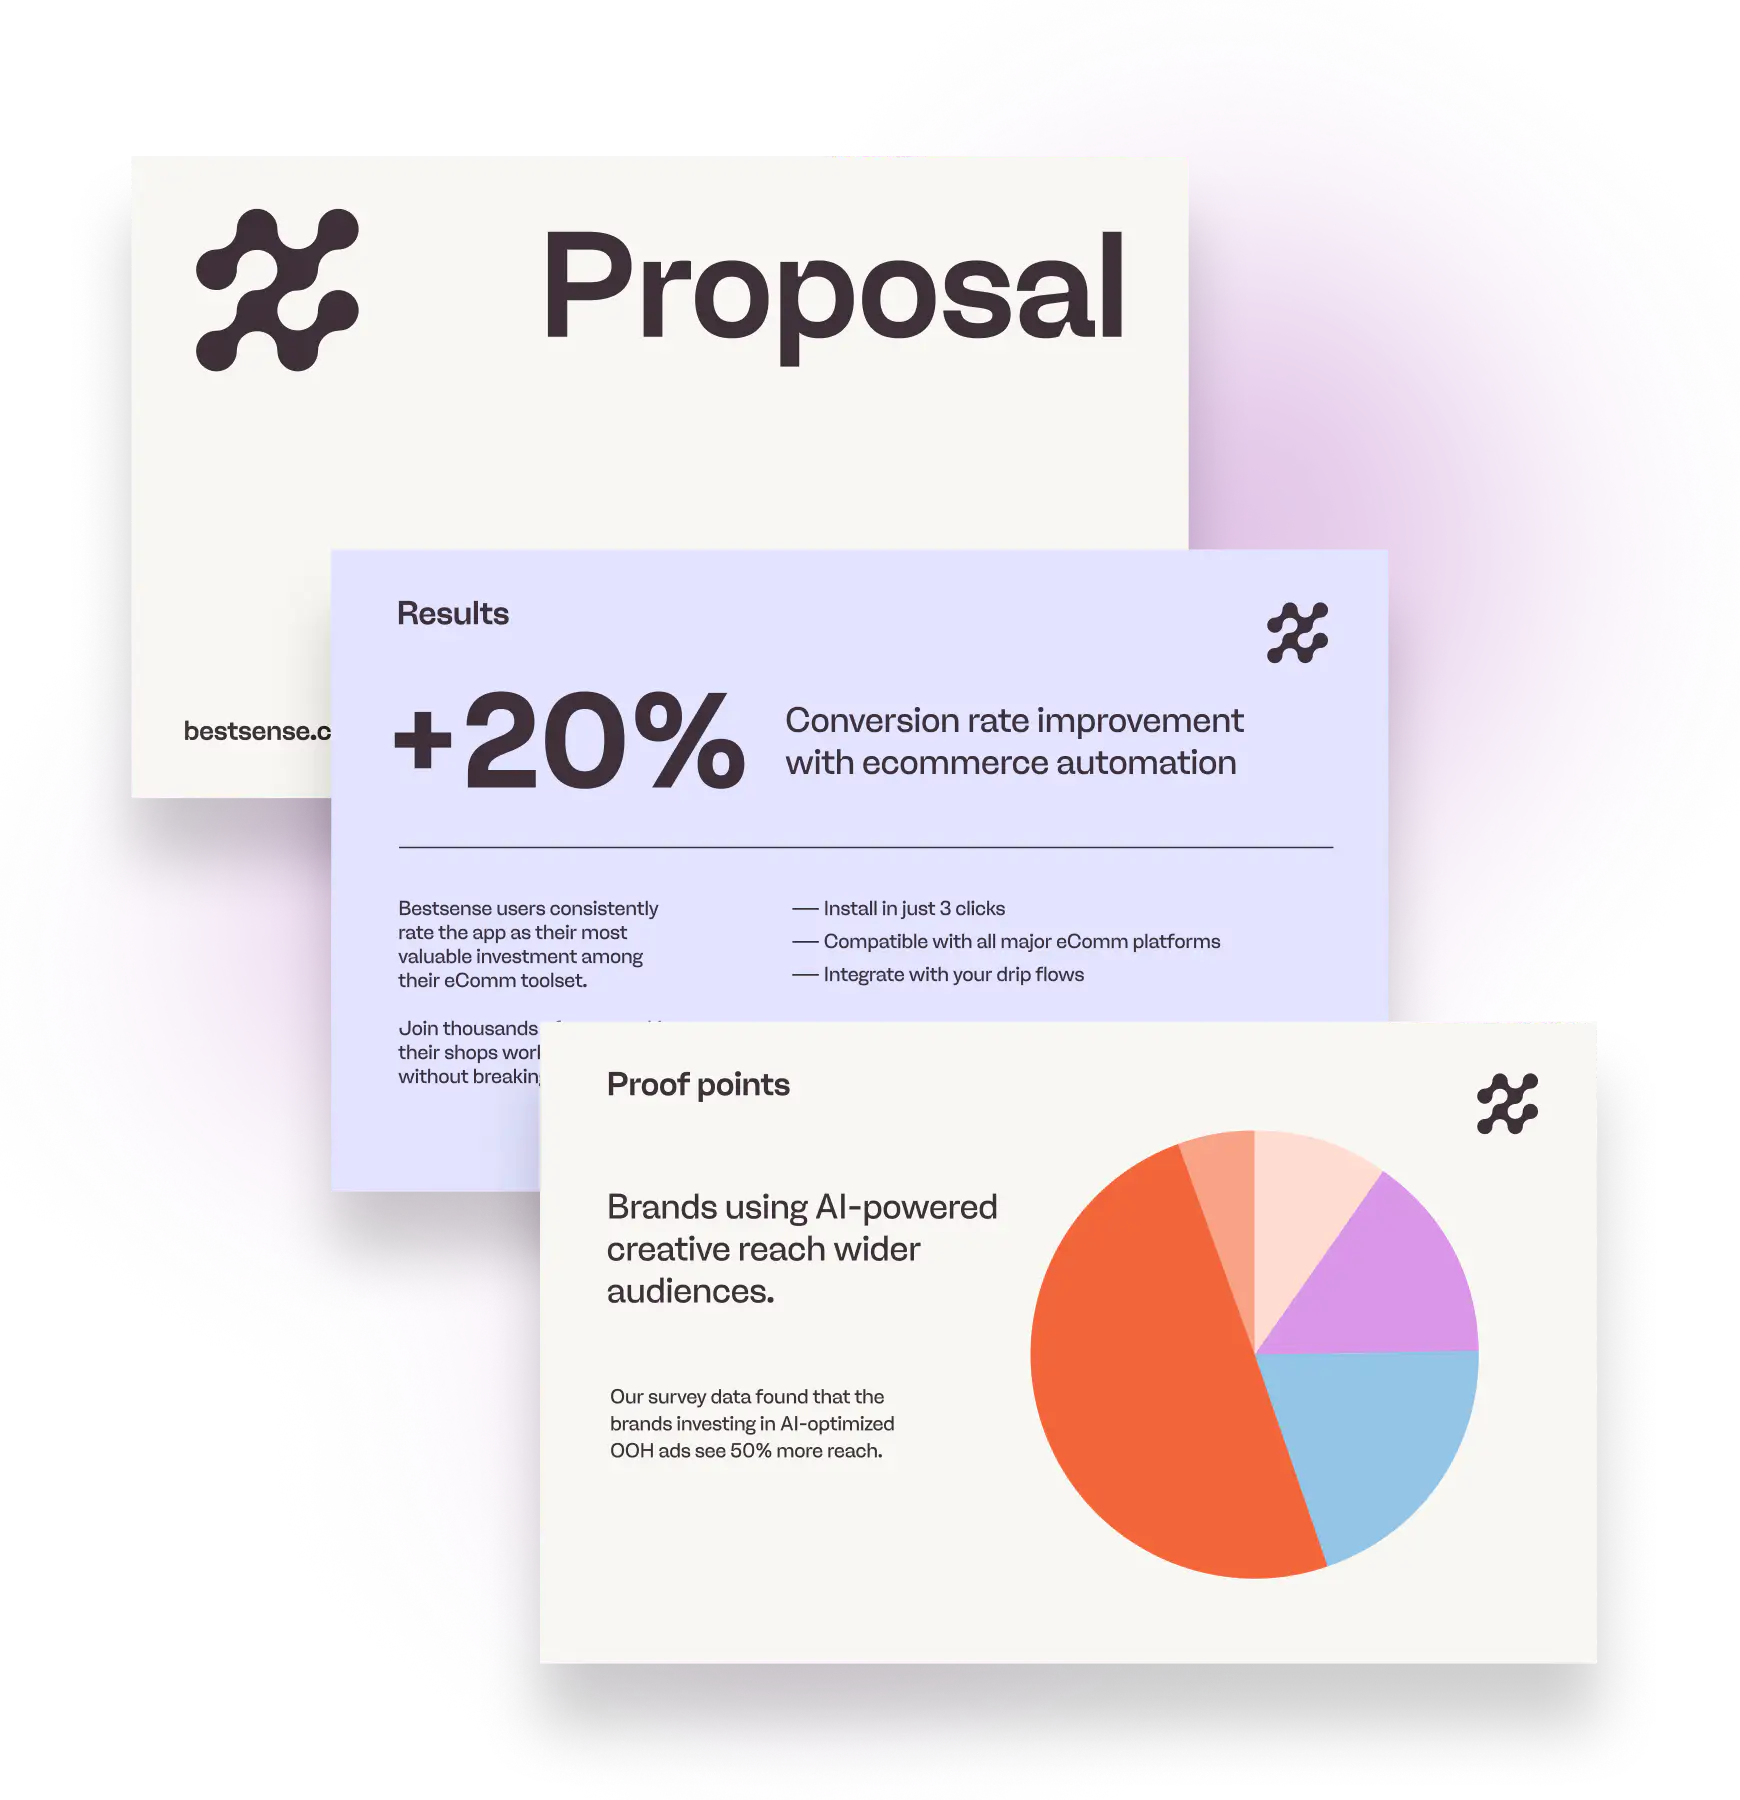
Create data visualizations for content like pitch decks, one pagers, and presentations, featuring your data.
Without Flowerplot
“Distribution is a huge lift of making sure the [research] project is successful. A way for you to communicate with your larger team — here’s what the marketing org put out, here’s where you can access these insights if you want to use it in a sales call — is a great benefit.”
—Researcher, enterprise B2B SaaS




Explore how more B2B teams are using Flowerplot



FAQs
How do I find an approved stat quickly when I’m prepping for a call?
Can I trust the stats I find, or do I need to double-check with the research team?
Can I filter stats by industry or vertical for account-specific outreach?
Can I export a stat or chart directly into a slide or one-pager?