
Pink and peach gradient
Feather icon

PR + media

Share insights that get your brand cited by the media

Share insights that get your brand cited by the media

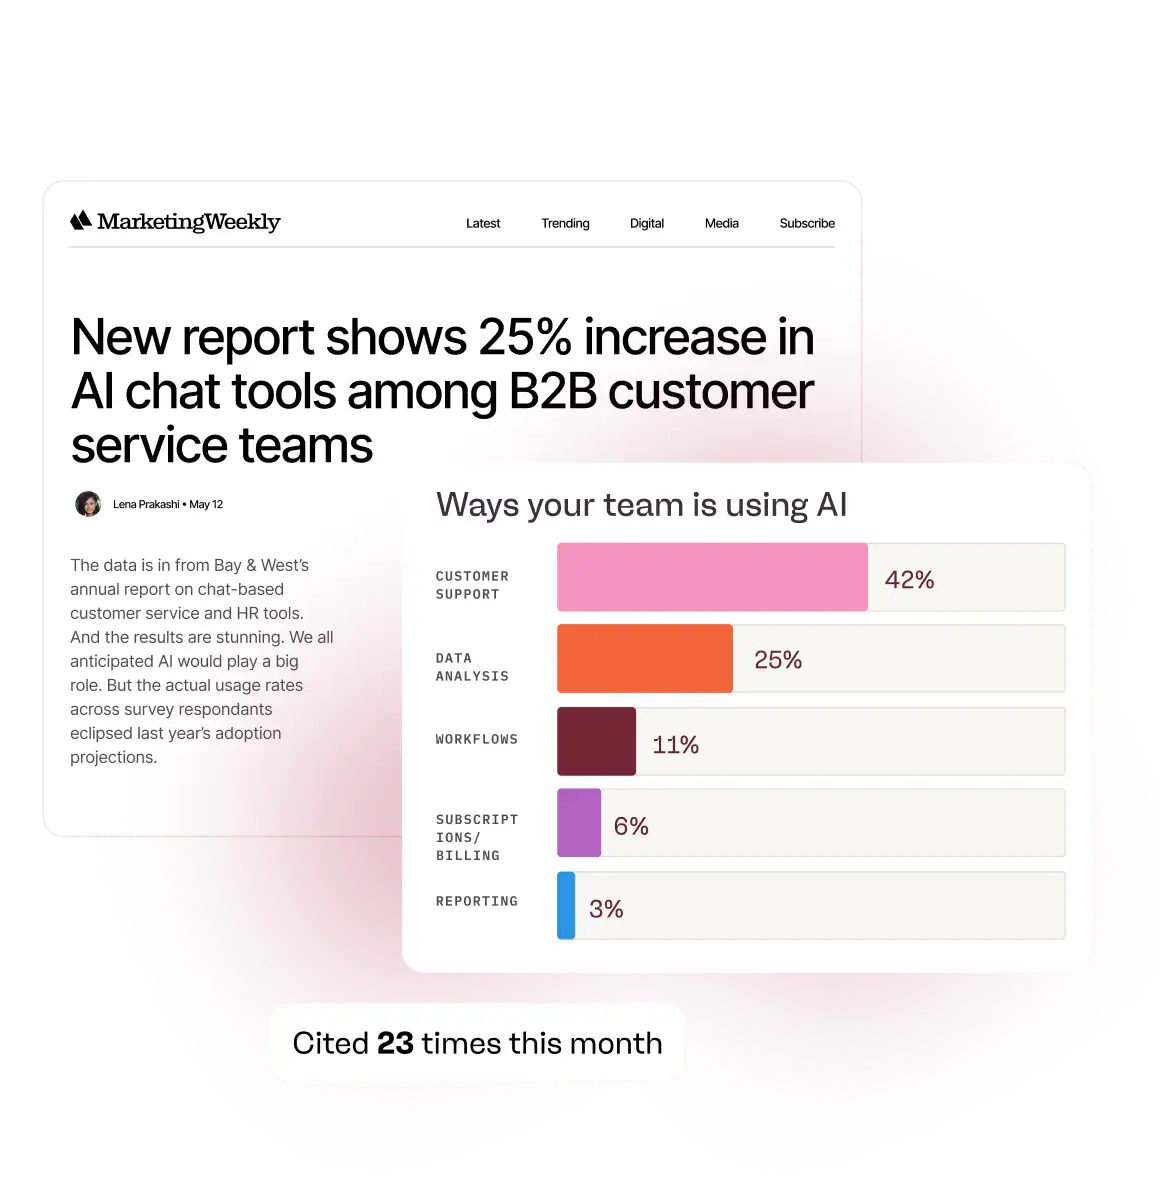
Original research is currency to PR and media teams. Uncover better data stories to catch journalists’ attention and show off your brand as a thought leader.

Creator video with audience insight cards
Pink and peach gradient
Feather icon

PR + media

Share insights that get your brand cited by the media

Original research is currency to PR and media teams. Uncover better data stories to catch journalists’ attention and show off your brand as a thought leader.

Creator video with audience insight cards
Deep wine gradient

Data-driven stories create buzz

73%

of marketers

publish 4+ survey-based reports or data-driven content pieces per year.

1 in 4

teams

use survey data in marketing content to generate PR/media coverage.

80%

of teams

collect survey data and never end up using it in their marketing.

Deep wine gradient

Data-driven stories create buzz

73%

of marketers

publish 4+ survey-based reports or data-driven content pieces per year.

1 in 4

teams

use survey data in marketing content to generate PR/media coverage.

80%

of teams

collect survey data and never end up using it in their marketing.

Want research that gets picked up by journalists and publications? Start here.

Want research that gets picked up by journalists and publications? Start here.

Want research that gets picked up by journalists and publications? Start here.

Analyze icon

Analyze

Get fast access to the data cuts you need

Get fast access to the data cuts you need

Get fast access to the data cuts you need

When journalists ask about data for specific sub-segments like regions or a certain demographic, you can get insights in seconds.

Without Flowerplot

“Cross-tabbing is the most difficult part. In massive spreadsheets, if it's a question with a lot of answer options, it's a really wide sheet and having to scroll across to compare Millennials versus Gen Z is time consuming.”

—Matilda Schieren, freelance content strategist, formerly Brand & Editorial, Sprout Social

Age breakdown donut chart over a pastel flower
Design icon

Curate

Create a library of approved, citable stats you can distribute

Create a library of approved, citable stats you can distribute

Create a library of approved, citable stats you can distribute

Once you’ve got the data to highlight your strongest stories, whether those are key insights, or designed charts, you can save them to your account and share them with anyone.

Without Flowerplot

“Data is what gets prospects and customers to pay attention and understand the value of our business. Sales and customer success are constantly asking our marketing and PR team 'Do we have a stat on this?'”

—Content strategist, enterprise B2B SaaS

Global style panel with brand fonts and colour palette
Uncover icon

Design

Build compelling, on-brand visuals for your data stories

Build compelling, on-brand visuals for your data stories

Build compelling, on-brand visuals for your data stories

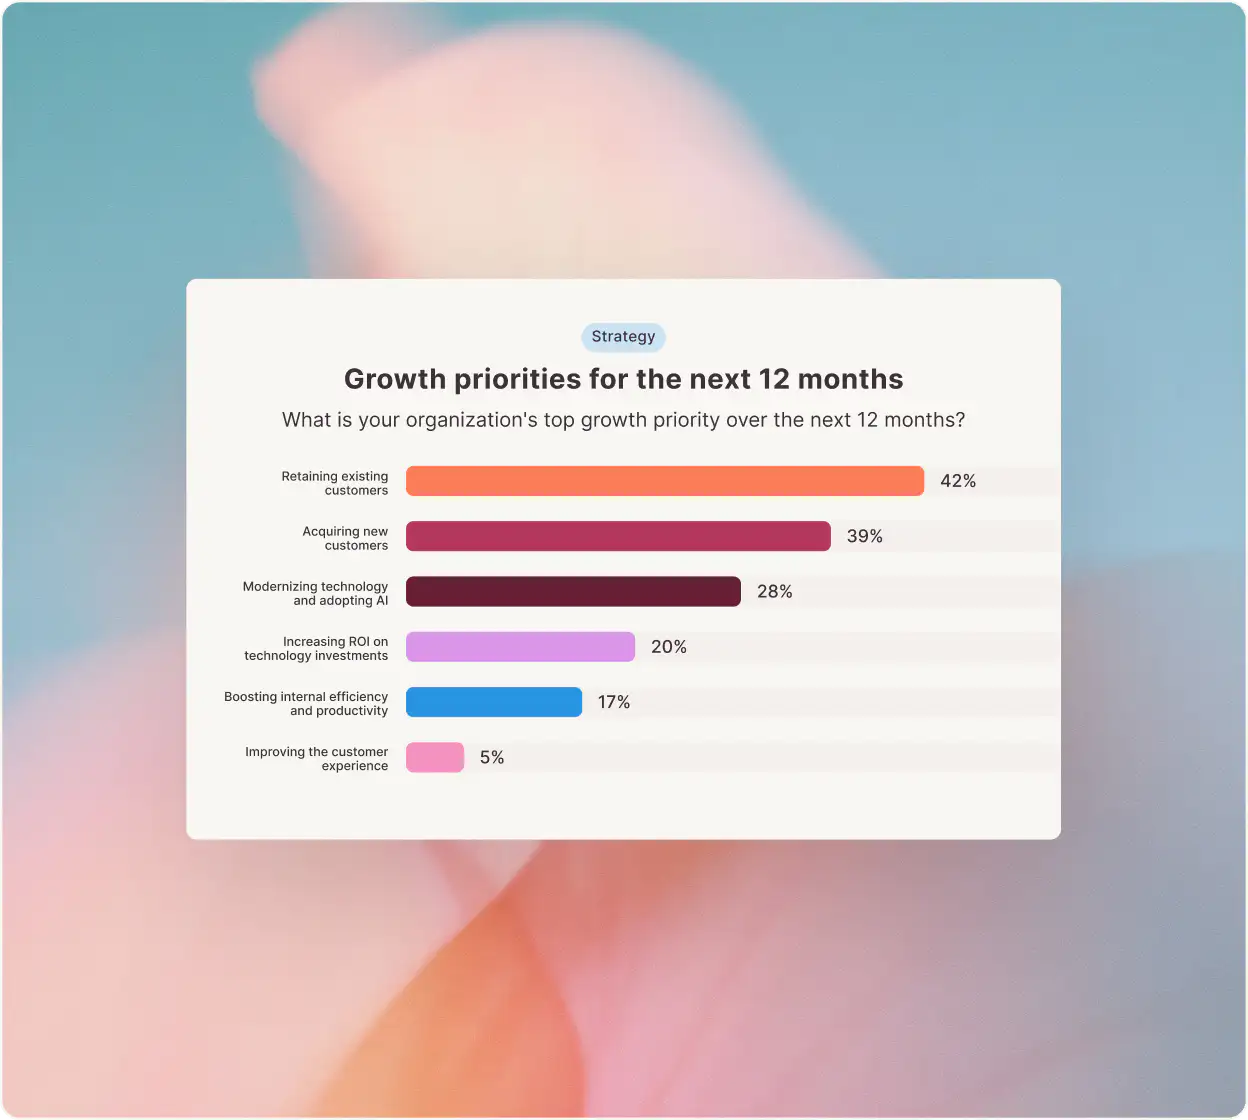
Produce and scale on-brand data visualizations for posts like news articles, press releases, and newsletters, featuring your data.

Without Flowerplot

“I spend so many hours manually converting percentages to pixel lengths and widths or prompting AI a ton to get something designed and on-brand. This would save a ton of time.”

—Paul Nowak, Senior Manager, Market Research, Sprout Social
Retail and ecommerce channel bar chart
Soft blue gradient

Customer Stories

Klaviyo

SuperOffice pulls insights and builds 
a narrative without an analyst

SuperOffice pulls insights and builds 
a narrative without an analyst

The marketing team at SuperOffice, the trusted CRM for European companies, needed to scale their research program and get insights from surveys without a data analyst.

5+ markets

Countries and markets collaborating on survey results

11+ users

SuperOffice's content, PR, and country-specific marketers use Flowerplot

Speed to insight

The team gets usable insights from Flowerplot faster than with Claude

"I’ve been so impressed by Flowerplot. We can use it for so much. Flowerplot’s AI agent makes it easy to get started. It’s like having a data analyst partner to consult with. We went from getting into the tool to finding insights quickly."

"I’ve been so impressed by Flowerplot. We can use it for so much. Flowerplot’s AI agent makes it easy to get started. It’s like having a data analyst partner to consult with. We went from getting into the tool to finding insights quickly."

Veronica Borg

Content Marketing Specialist, SuperOffice

Soft blue gradient

Customer Stories

Klaviyo

SuperOffice pulls insights and builds 
a narrative without an analyst

The marketing team at SuperOffice, the trusted CRM for European companies, needed to scale their research program and get insights from surveys without a data analyst.

5+ markets

Countries and markets collaborating on survey results

11+ users

SuperOffice's content, PR, and country-specific marketers use Flowerplot

Speed to insight

The team gets usable insights from Flowerplot faster than with Claude

"I’ve been so impressed by Flowerplot. We can use it for so much. Flowerplot’s AI agent makes it easy to get started. It’s like having a data analyst partner to consult with. We went from getting into the tool to finding insights quickly."

Veronica Borg

Content Marketing Specialist, SuperOffice

Warm gradient

Turn data into branded insights.

Warm gradient

Turn data into branded insights.

FAQs

Can we cite data pulled from Flowerplot to the media?

How fast can we get a stat for a reporter on deadline?

Can we use data from a survey that was fielded months ago?

How do we know a stat is safe to use without double-checking with the research team?

Can charts be exported in a press-ready, on-brand format?
