

Get more eyes on your marketing survey findings
Catch your target audience’s attention with engaging data visualizations that showcase your brand’s thought leadership.

Trusted by leading B2B teams
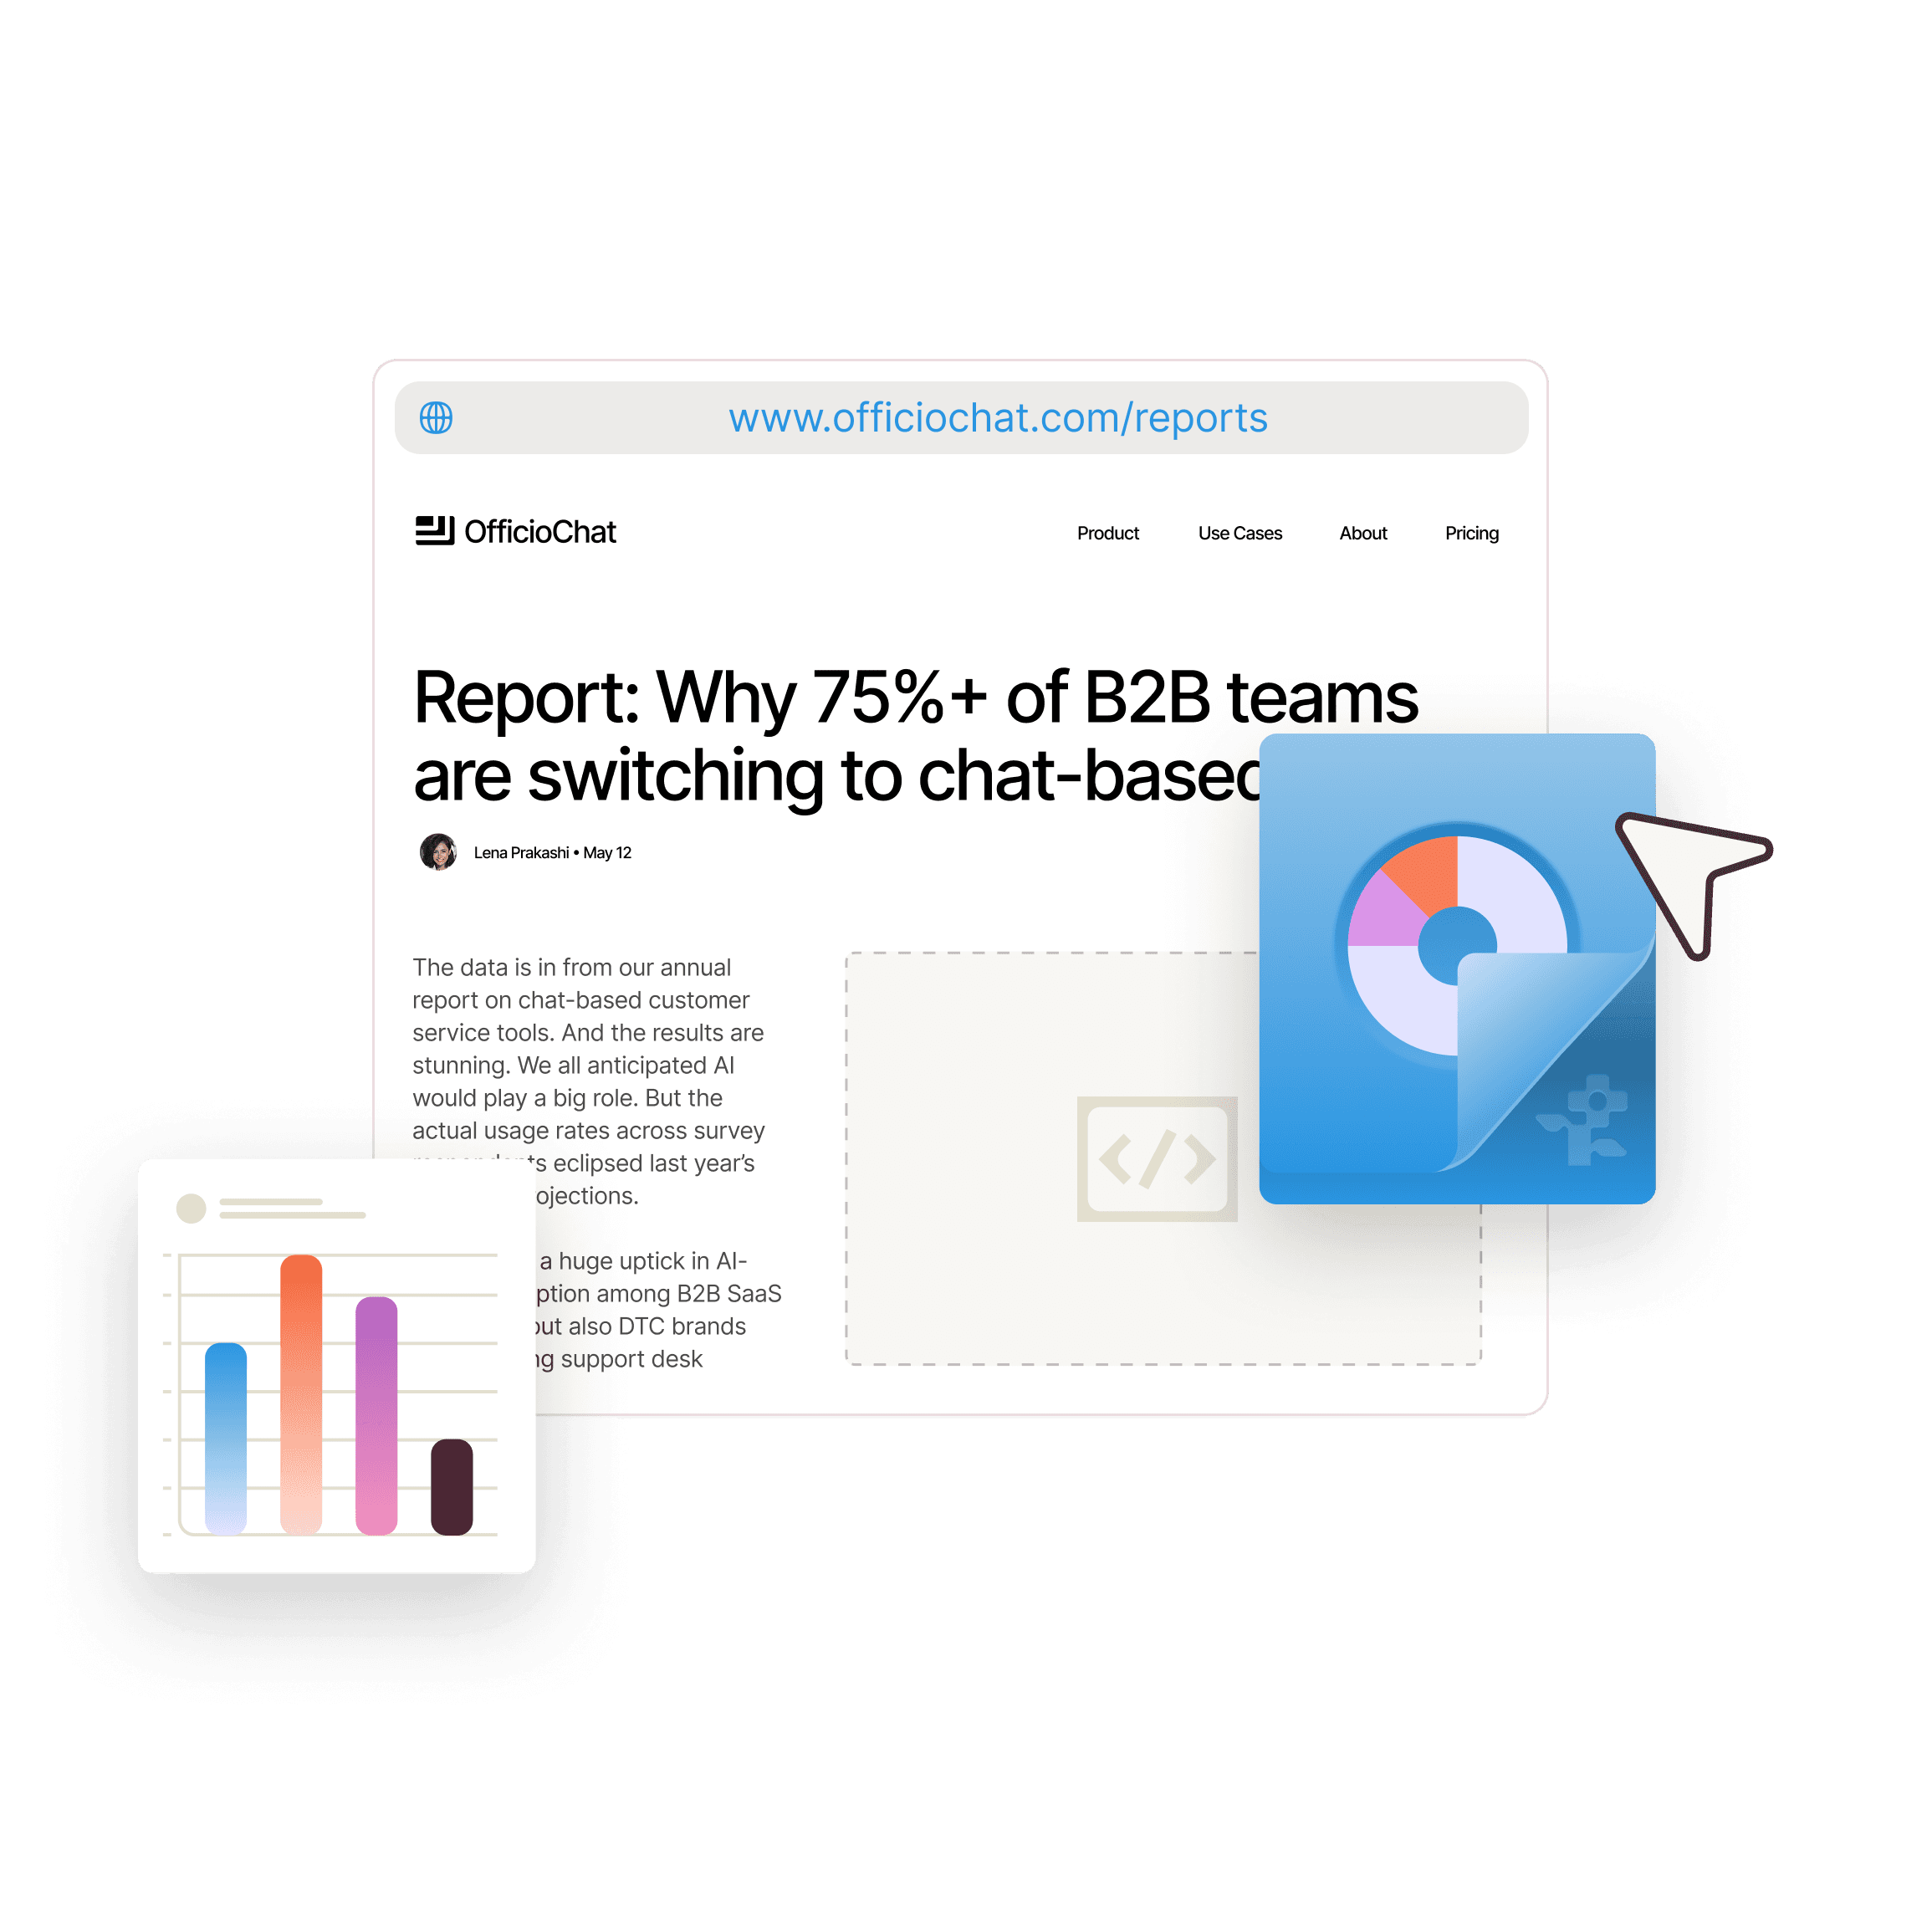
Share your data-driven insights far and wide

Collaborators
DL
Daisy Lee
daisy@flowerplot.com
Sales
Emily Duff
emily@flowerplot.com
ED
Social
Mina Kim
mina@flowerplot.com
MK
PR
Collaborate on survey findings
Get feedback on data as you go from analysis to insight to design by sending live links.

64%
of teams use text-based AI tools, almost twice the adoption rate of video/audio AI tools (35%).
Q2

80%
Nearly 80% of respondents work in companies with fewer than 100 employees (Q1), yet adoption of AI tools is already significant, with 44.5% using ChatGPT and 35%+ using video or audio AI tools.
Q2
Q5

42%
For company culture videos, 42.1% of respondents express interest in using AI
Q8
Create a stat library for your team
Save approved insights and charts for your whole team to use in content.


rESEARCH
Show off your data
Highlight your proprietary research across the web, while growing brand awareness.
“I’ve been so impressed by Flowerplot. We can use it for so much. As a marketer, I’m used to prompting AI, but Flowerplot’s AI agent makes it easy to get started. It’s like having a data analyst partner to consult with. We went from getting into the tool to finding interesting insights quickly.”




FAQs
Can we save insights and charts for later use?
Can other teams (sales, PR, social) access saved insights without bugging our research team?
Can we publish charts as embeddable, interactive visuals — not just static images?
Does every published chart carry our branding and methodology info?