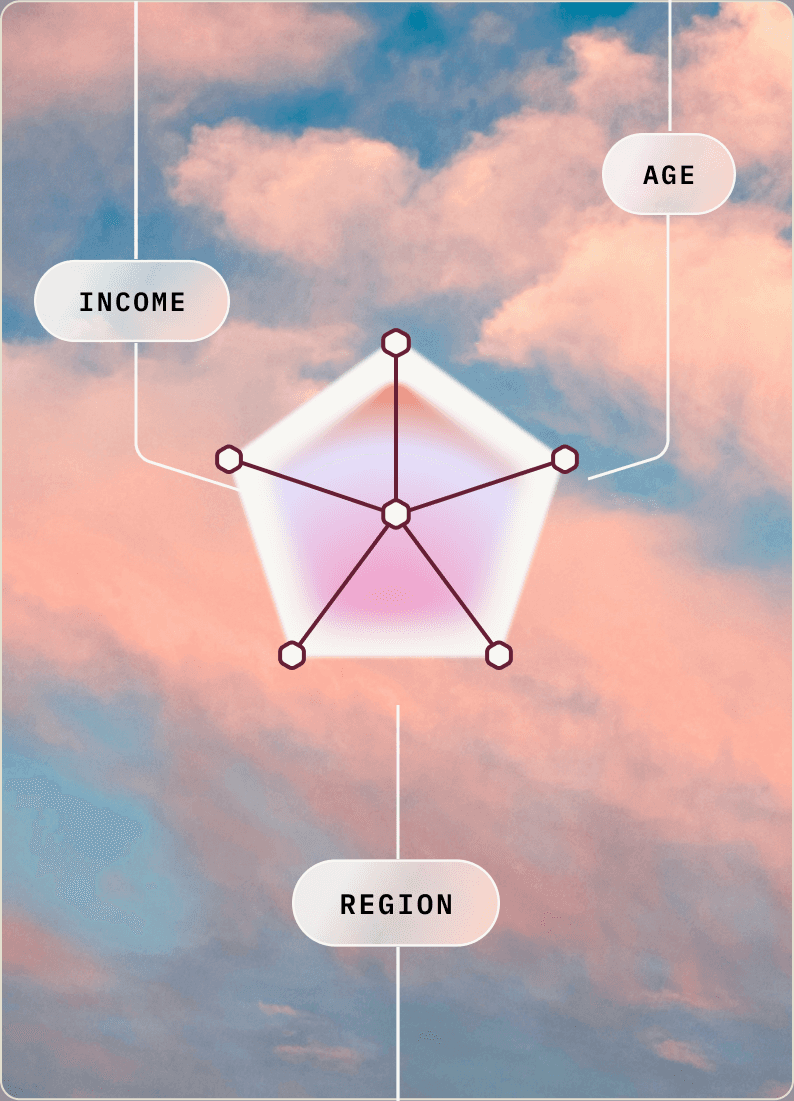
Pink and peach gradient
Feather icon

Content marketing

Uncover the data that fuels your best-performing content

Uncover the data that fuels your best-performing content

You know that content with original research performs better, gets cited, and influences buyers. Get marketing-ready insights and visualizations for everything you publish.

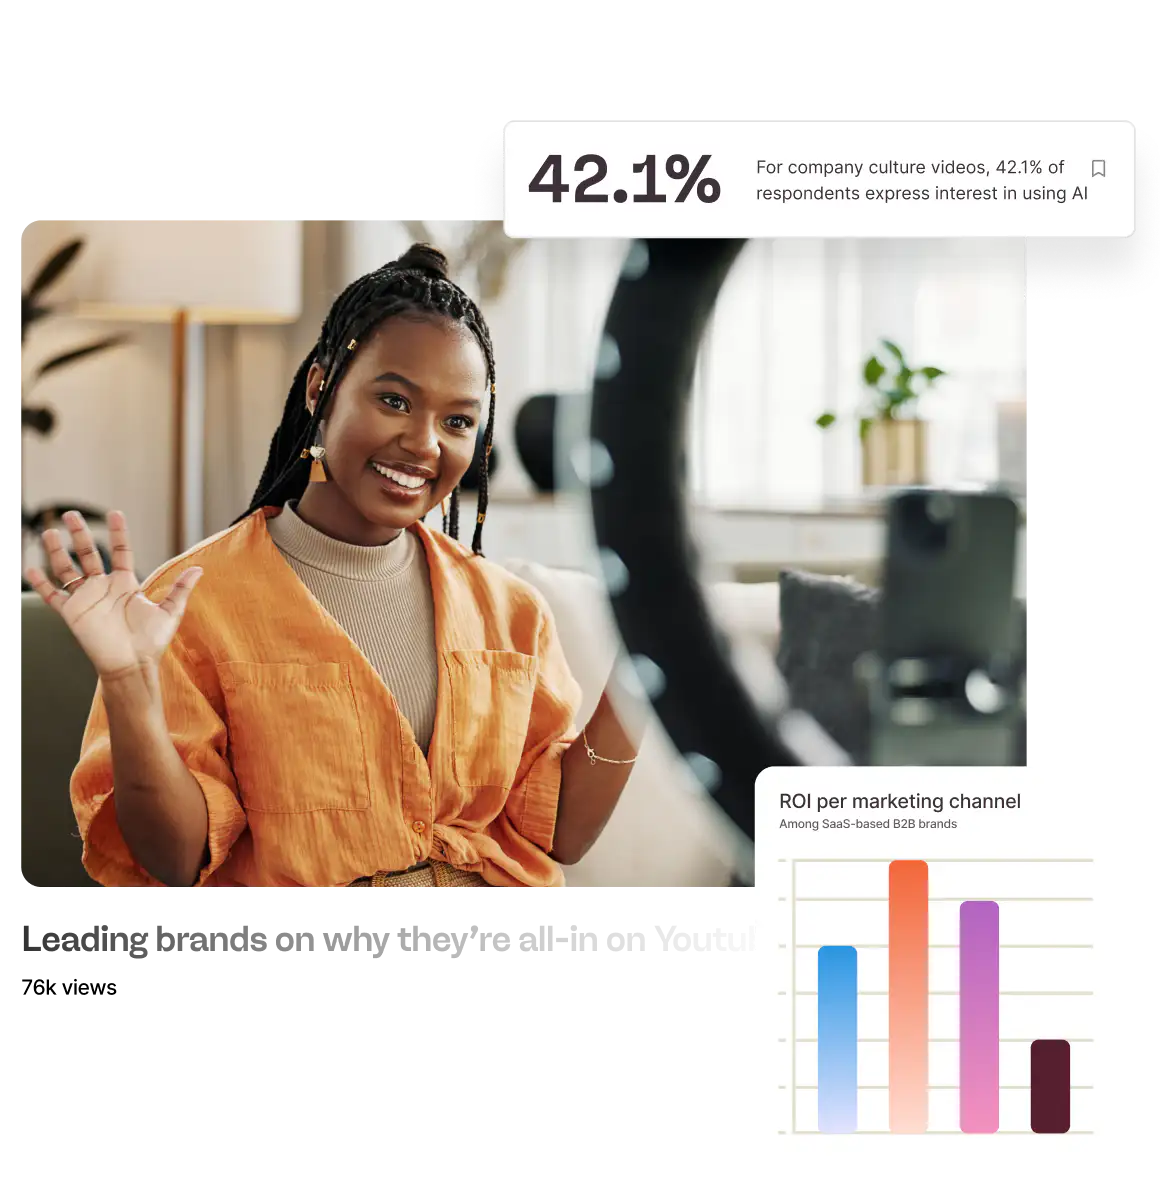
Creator video with audience insight cards
Pink and peach gradient
Feather icon

Content marketing

Uncover the data that fuels your best-performing content

You know that content with original research performs better, gets cited, and influences buyers. Get marketing-ready insights and visualizations for everything you publish.

Creator video with audience insight cards
Deep wine gradient

Research-driven content is your marketing differentiator

37%

of teams

spend 1-2+ weeks pulling insights from survey data into marketing content.

4-5

team members involved

on average in taking survey data from analysis to content.

80%

of teams

collect survey data and never end up using it in their marketing.

Deep wine gradient

Research-driven content is your marketing differentiator

37%

of teams

spend 1-2+ weeks pulling insights from survey data into marketing content.

4-5

team members involved

on average in taking survey data from analysis to content.

80%

of teams

collect survey data and never end up using it in their marketing.

You ran a marketing research survey. Now what?

You ran a marketing research survey. Now what?

You ran a marketing research survey. Now what?

Analyze icon

Analyze

Go from raw data to unique content

Go from raw data to unique content

Go from raw data to unique content

Explore survey data through a visual interface and pull data cuts for your next content campaign like an industry trends report, blog post, or social media series.

Without Flowerplot

“Cross-tabbing is probably the most difficult part. In massive spreadsheets, if it’s a question with a lot of answer options, it’s a really wide sheet and having to scroll across to compare Millennials versus Gen Z is annoying.”

—Matilda Schieren, freelance content strategist, formerly Brand & Editorial, Sprout Social

Age breakdown donut chart over a pastel flower
Design icon

Design

Create on-brand charts without significant design resources

Create on-brand charts without significant design resources

Create on-brand charts without significant design resources

Customize your charts directly from your survey data, using your brand colors, fonts, and logo, and choosing details like bar width, rounded corners, and data label placements.

Without Flowerplot

“If you don’t pay for a plugin, Figma doesn’t have the ability to upload your data sets. So I’m literally just manually converting percentages to pixel lengths and widths. This would save a ton of time.”

—Paul Nowak, Senior Manager, Market Research, Sprout Social

Global style panel with brand fonts and colour palette
Uncover icon

Uncover

Build a library of approved stats your whole team can use

Build a library of approved stats your whole team can use

Build a library of approved stats your whole team can use

Save key insights and charts from any survey and organize them so teams like sales, PR, social, and product marketing can find and use approved stats anytime.

Without Flowerplot

“Sales and customer success are constantly in Slack asking ‘do we have a stat on this?’”

—Content strategist, enterprise B2B SaaS

Retail and ecommerce channel bar chart
Soft blue gradient

Customer Stories

Klaviyo

SuperOffice pulls insights and builds a narrative without an analyst

SuperOffice pulls insights and builds a narrative without an analyst

The marketing team at SuperOffice, the trusted CRM for European companies, needed to scale their research program and get insights from surveys without a data analyst.

5+ markets

Countries and markets collaborating on survey results

11+ users

SuperOffice's content, PR, and country-specific marketers use Flowerplot

Speed to insight

The team gets usable insights from Flowerplot faster than with Claude

"I’ve been so impressed by Flowerplot. We can use it for so much. Flowerplot’s AI agent makes it easy to get started. It’s like having a data analyst partner to consult with. We went from getting into the tool to finding insights quickly."

"I’ve been so impressed by Flowerplot. We can use it for so much. Flowerplot’s AI agent makes it easy to get started. It’s like having a data analyst partner to consult with. We went from getting into the tool to finding insights quickly."

Veronica Borg

Content Marketing Specialist, SuperOffice

Soft blue gradient

Customer Stories

Klaviyo

SuperOffice pulls insights and builds a narrative without an analyst

The marketing team at SuperOffice, the trusted CRM for European companies, needed to scale their research program and get insights from surveys without a data analyst.

5+ markets

Countries and markets collaborating on survey results

11+ users

SuperOffice's content, PR, and country-specific marketers use Flowerplot

Speed to insight

The team gets usable insights from Flowerplot faster than with Claude

"I’ve been so impressed by Flowerplot. We can use it for so much. Flowerplot’s AI agent makes it easy to get started. It’s like having a data analyst partner to consult with. We went from getting into the tool to finding insights quickly."

Veronica Borg

Content Marketing Specialist, SuperOffice

Warm gradient

Turn data into branded insights.

Warm gradient

Turn data into branded insights.

FAQs

Our content team doesn’t have a data analyst. Can we still use Flowerplot?

We already work with a data provider that sends us analysis. Do we still need this?

Can multiple team members access the same survey data in Flowerplot?

We ran this survey six months ago. Can we still use Flowerplot with it?

How do I know the AI-generated insights are accurate?

Does Flowerplot work with our survey platform?